
Driven by increased awareness of environmental issues, the electric vehicle market is experiencing an unprecedented surge in the United States. The popularity of electric vehicles (EVs) has led to an increase in demand for charging stations and, consequently, a growing interest in the EV charging stations market. With sales of plug-in EVs having nearly doubled in the country and EVs projected to occupy approximately 45% of the total US market by 2035, it is important to explore trends in the EV charging station market in the United States.
Figure 3.1 Projected U.S. electric vehicle market share between 2030 and 2045
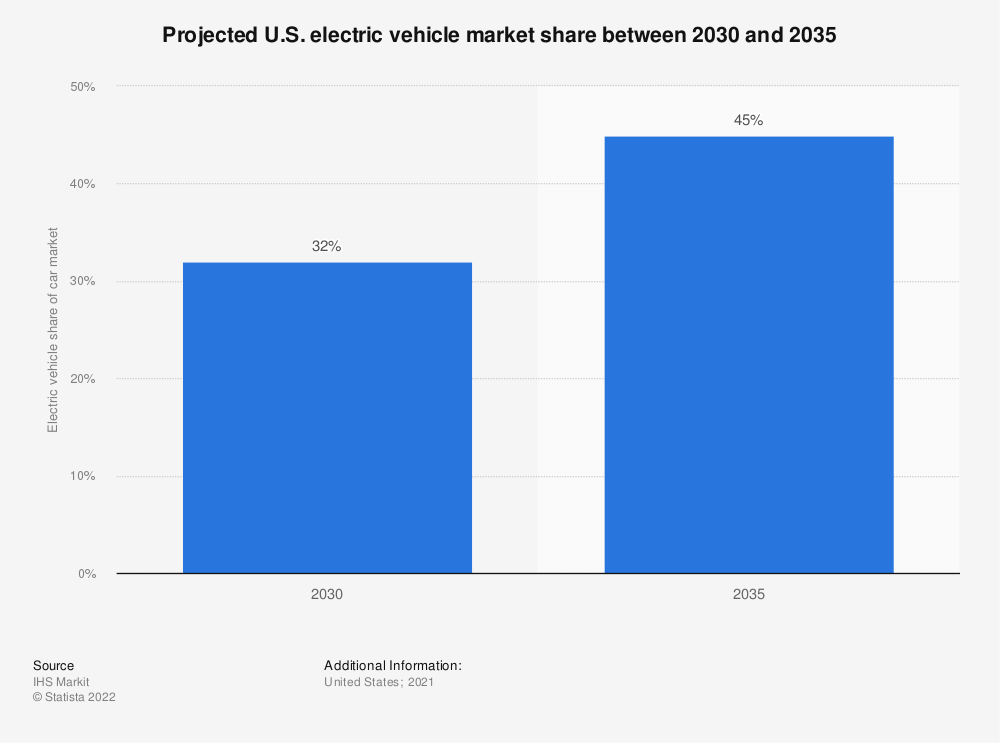
Source: Statista
However, to meet the energy demands of a growing EV fleet, the U.S. charging infrastructure will also have to become more accessible to customers. In 2021 there were 40,047 charging stations scattered all around the country, an increase of 48% compared to the previous year. The number of new installations started to take off in 2011. Since then, the average annual increase has been around 60%.
Figure 3.2 Growth in the number of electric charging stations, 1995-2021
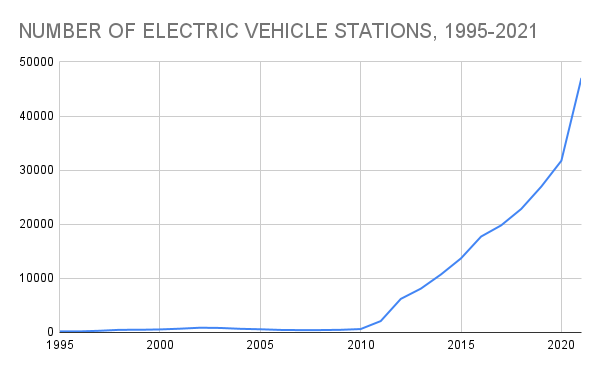
Source: U.S. Department of Energy. Alternative Fuels Data Center.
As of December 10th, 2022, the number of public electric vehicle charging stations and charging outlets in the U.S. is:
| NUMBER OF UNITS | |
| CHARGING STATIONS | 49,366 |
| EVSE PORTS | 128,006 |
Source: U.S. Department of Energy. Alternative Fuels Data Center.
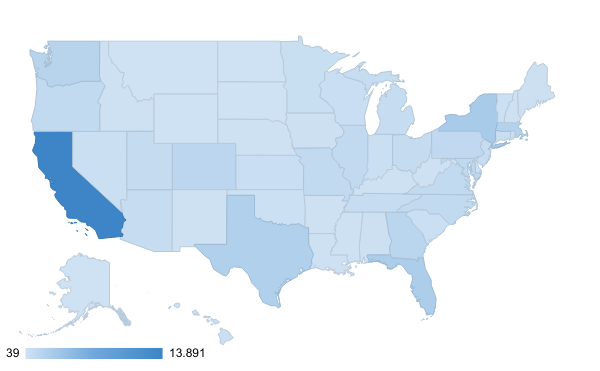
This translates into 38 EVSE ports per 100,000 people in the U.S. But, some states have significantly more charging stations than others. At the end of 2021, California is the state with the largest electric charging station network (13,891 stations), followed far behind by the states of New York (2.774), Florida (2.480) and Texas (2.190). At first glance, there is a correlation between GDP and the number of charging stations; the richer the state, the higher is the number of charging stations.
Map 3.1 Charging stations density by state
Source: U.S. Department of Energy. Alternative Fuels Data Center.
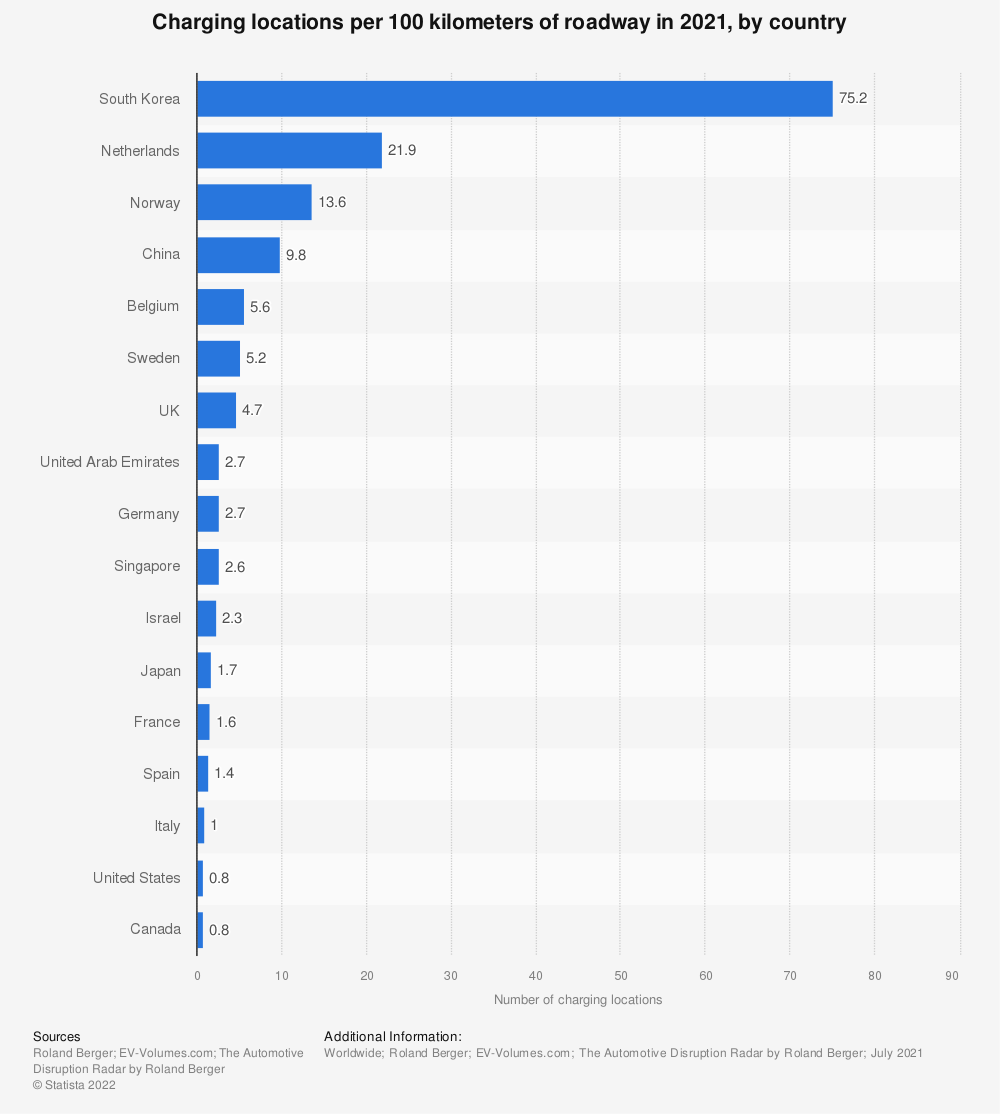
On average, there was under 1 charging location per 100 km of roadway in the U.S. in 2021.
Figure 3.3 Charging locations per 100 km of roadway in 2021, by country
Source: Statista
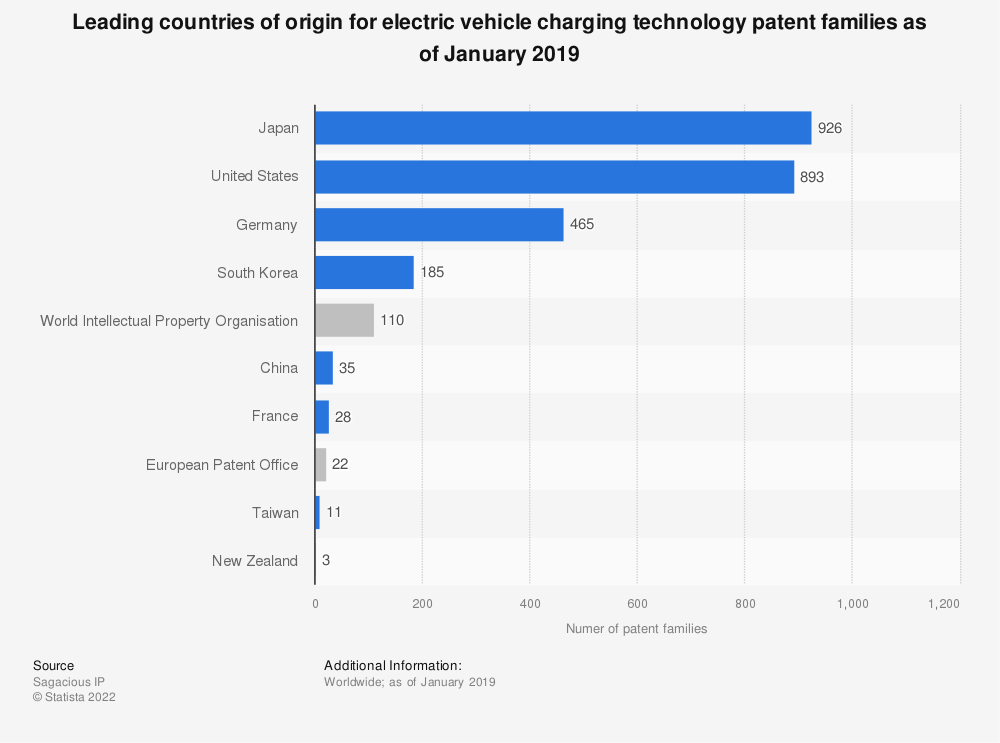
While the U.S. has not yet matched consumer demand, it is at the forefront of EVSE innovation. In 2019, the U.S. was the second leading country of origin for EV charging technology patent families. American multinational companies Qualcomm and Ford were among the companies filing the most EV charging infrastructure patent families, both in the U.S. and worldwide. Tesla – the plug-in EV market leader in the U.S. in 2021 – also filed most of its patents between 2000 and 2020 in the United States, with 307 patent families filed in the energy generation and storage technology areas.
Figure 3.4 Leading countries of origin for electric vehicle charging technology patent families as of January 2019
Source: Statista
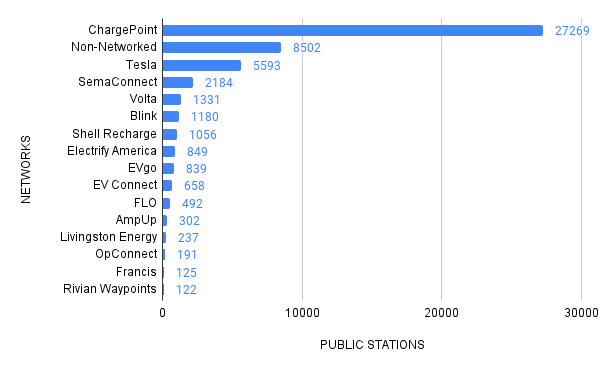
However, while Tesla’s vehicle sales soared in 2021, the manufacturer encountered stiff competition in the electric charging stations market. The ChargePoint Network is the leading public charging station network in the U.S., as of December of 2022, with a charging station volume far greater than Tesla Destination stations.
Figure 3.5 Main networks
Source: Department of Energy. Alternative Fuels Data Center.
ChargePoint Network is the largest provider of public electric charging stations across the United States, recording 27,269 stations. The provider dwarfed all other networks, with non-networked charging stations coming in second in the ranking, at 8,502 stations in the country.
However, ChargePoint incurred net losses of $132.2 million, $197.0 million, and $134.3 million for the fiscal year 2021, 2020, and 2019, respectively. As of January 31, 2022 and 2021, the company had an accumulated deficit of $811.7 million and $679.4 million, respectively. ChargePoint has experienced rapid growth and this will continue to exacerbate the operating expenses and net losses in future quarters for the near term.
This is a hurdle that other charging networks also faced: Blink Charging, the leading private station network in 2022, recorded a net loss of around USD 55.1 million in the 2021 fiscal year. The U.S. charging infrastructure, while boosted by American companies, still has a long road ahead for profitability. They are particularly dependent upon the continued adoption of EVs by consumers and fleet operators, the widespread adoption of electric trucks, other vehicles and other electric transportation modalities, which are still in the very early stages of adoption and may not occur.
Most major manufacturers of passenger cars, trucks of all sizes, buses, and industrial vehicles have committed to electrification, and governments have made it clear from both policy and funding perspectives that the future of transportation is electric.
The Biden administration has established a goal of building a national public charging network of 500,000 EV chargers by 2030, through the NEVI (National Electric Vehicle Infrastructure) formula program for the adoption and expansion in use of EVs and the Discretionary Grant Program for Charging and Fueling Infrastructure. These programs have provided USD 7.5 billion (collectively) in Federal funds for the nationwide development of EV charging infrastructure. It will provide dedicated funding to States to strategically deploy EV charging infrastructure and establish an interconnected network to facilitate data collection, access, and reliability.
The NEVI Formula Program will initially be focused on building out charging infrastructure along the interstate highway system with DC fast EVSE ports, and the Discretionary Grant Program is expected to fund both DC fast and Level 2 EVSE ports. To meet this goal by 2030, approximately 12,390 public EVSE port installations will need to be deployed each quarter for the next 8 years.
The majority of public EVSE ports are Level 2, followed far behind by DC fast:
CHARGER TYPES | STATION LOCATIONS |
| Level 1 | 258 |
| Level 2 | 50,834 |
| DC fast | 8,003 |
Source: Department of Energy. Alternative Fuels Data Center
However, DC fast EVSE ports is increasing at a higher rate:
Figure 3.6 EVSE port growth, by charging level
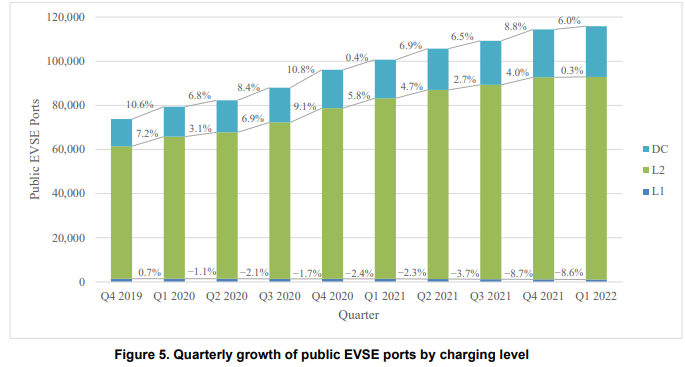
Source: NREL. Electric vehicle charging infrastructure trends from the Alternative Fueling Station locator: First quarter 2022
When compared with Level 1 and Level 2 chargers, DC fast chargers have the highest power output and therefore provide the most charge in the least amount of time. Building out the country’s network of public DC fast chargers is critical to supporting EV adoption in the United States. Whereas the power output for Level 1 chargers is about 1 kW and Level 2 chargers can operate at up to 19 kW, DC fast chargers have a typical power output of 50 kW, and DC fast chargers with higher levels of power output are increasingly available. Extreme fast charging infrastructure, which has a power output of 350 kW or more, was introduced in 2018.
As shown in Figure 3.7, the number of EVSE ports with a power output between 51 kW and 149 kW grew by the largest percentage in Q1 2022 (158.0%). Some networks temporarily reduce the power output of their DC fast chargers while maintenance or upgrades are being performed, which is the primary driver behind the increase in EVSE ports with a power output between 51 KW and 149 kW and decrease in EVSE ports with a power output between 150 and 249 kW. This occurred on ChargePoint’s network in Q1: approximately 1,000 EVSE ports were derated from 155 kW, 175 kW, or 200 kW down to 50 kW or 62 kW.
Additionally, the large increase in EVSE ports with a power output between 250 and 349 kW is due to new Tesla Supercharger installations with a power output of 250 kW.
Figure 3.7 Quarterly growth of public DC fast EVSE ports by power output
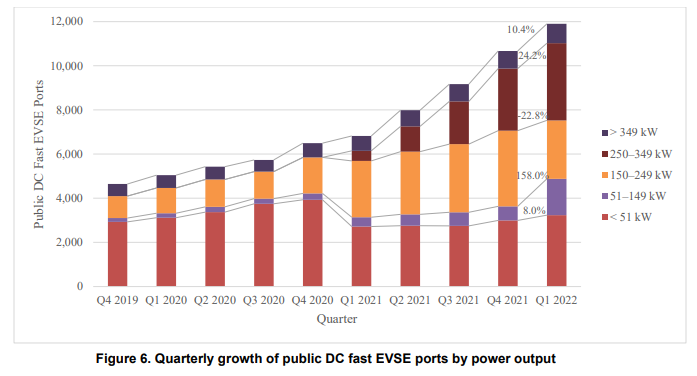
Source: NREL. Electric vehicle charging infrastructure trends from the Alternative Fueling Station locator: First quarter 2022
Most EV models entering the market today can charge using the CCS connector. Although Tesla vehicles do not have a CHAdeMO charge port and do not come with a CHAdeMO adapter, Tesla does sell an adapter that allows Tesla vehicles to charge at DC fast chargers that have a CHAdeMO connector. Additionally, Tesla is in the process of making a CCS adapter for Tesla vehicles.
In conjunction with state guidance on the NEVI Formula Grant Program, the Federal Highway Administration announced the opening of Round 6 of Alternative Fuel Corridor nominations. Previously, for a National Highway System segment to be designated as corridor-ready for EV charging, each DC fast charging station was required to have both CCS and CHAdeMO connectors available but was not required to have a minimum power output. The Federal Highway Administration changed these criteria in Round 6 to require that each DC fast charging station has at least four EVSE ports with CCS connectors and a minimum power output of 150 kW. These new criteria will encourage faster growth in CCS installations, as well as installation of higher-powered chargers. Additionally, corridor ready segments must have at least two DC fast charging stations no more than 50 miles (80.47 km) from each other and no more than 1 mile (1.61 km) from an interstate exit.
Figure 3.8 Number of electric vehicle fast charging stations in the U.S. as of december 2022, by technology:
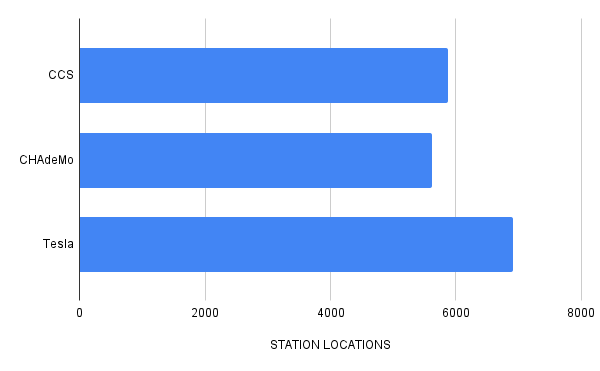
Source: Department of Energy. Alternative Fuels Data Center.
State and local governments are continuing to institute policies and establish goals to support increased EV adoption as well. Notably, a growing number of cities are requiring commercial buildings and multifamily housing complexes to make parking spaces available to accommodate EV charging infrastructure. More than 30 municipalities have passed these requirements, which will add more charging for communities.